I currently study RR Lyrae stars, which are stars about the mass of the Sun that have started to die. During this process, their atmospheres become unstable and start to pulsate, causing them to change brightness (measured in units called magnitudes) in a repeating pattern. (See this animation by Dr.s J. Hartman and K. Stanek to see RR Lyrae in a star cluster.) A plot of these changes in brightness over time is called a light curve. Thanks to a well-studied relationship between their intrinsic brightness and how fast they pulsate, if you measure an RR Lyrae star’s period, or how long it takes to complete one cycle of pulsation, you can estimate how far away it is. Because of this, RR Lyrae stars are very useful for determining distances to star clusters and galaxies, and can even be used to find them!
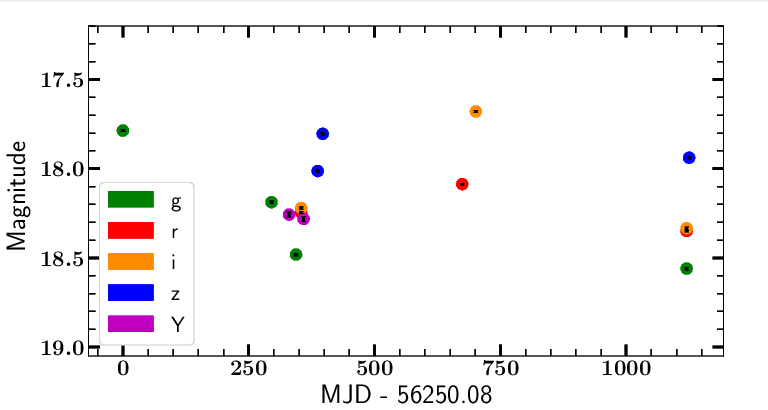
To correctly classify the object based on its time series data, one must first estimate the period of the brightness variations. My research specifically focuses on identifying these stars using very few observations taken in multiple filters. This is difficult because you typically need many observations in one filter to correctly estimate the period, but the data I use from the Dark Energy Survey only has 4-5 observations in each filter so far. Even though there are observations available in multiple filters, it is difficult to combine them because the brightness of an RR Lyrae changes different amounts in each separate filter. An example of this time series data is shown below (the colors correspond to data from different filters and MJD stands for “Modified Julian Date” which is measured in days).

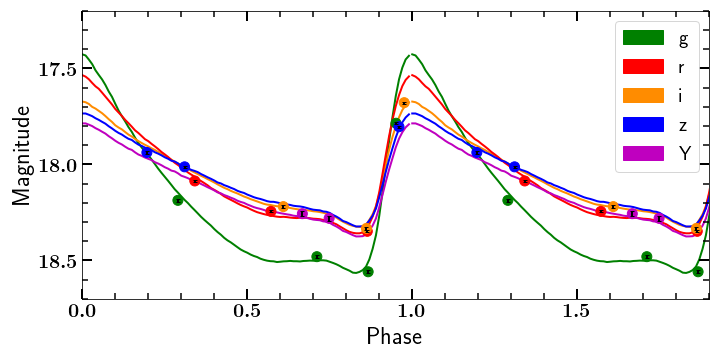
To make best use of the data we have, one of my previous advisors, Prof. James Long, developed a model that takes these filter offsets into account and uses all the data simultaneously to estimate the period. Below is an example of this model in action on sparse time series data from a real RR Lyrae star. The horizontal axis is now in units of phase, which is the modulo of the date of the observation and the estimated period.

To isolate potential RR Lyrae stars out of the billions of light curves in the Dark Energy Survey data, I applied simple variability cuts to the data to select objects showing brightness variations. Then, I fit the model shown above to hundreds of thousands of these light curves across a computer cluster. Then, I trained a Random Forest classifier to identify likely RR Lyrae stars out of all of these light curves based on how well their data matched the model shape. I identified thousands of these variables. This work has been submitted. The paper and data products will be available soon.
For more information about RR Lyrae stars, the American Association of Variable Star Observers (AAVSO) has an excellent summary article.